本文主要讲解Prometheus安装配置使用Grafana图形展示,并接入Email、Dingtalk、Wechat警报。
Prometheus安装及配置
在监控神器Prometheus(1)中已经介绍了Prometheus的相关特性与数据类型,现在我们讲解下如何安装配置使用Grafana图形展示,并接入Email、Dingtalk、Wechat警报,Prometheus已经完美的支持Email、Slack、Dingtalk、Wechat警报。
系统/软件版本
- System:Ubuntu 18.04
- Prometheus 2.13.0
- Node_Exporter 1.18.0
- Alaermanager 1.18.0
- Dingtalk-webhook 0.3.0
- Grafana 6.4.0
二进制安装
PROM_PATH='/data/prometheus'
mkdir -p ${PROM_PATH}
mkdir -p ${PROM_PATH}/{data,conf,logs,bin}
useradd prometheus
cd /usr/local/src
wget https://github.com/prometheus/prometheus/releases/download/v2.13.0/prometheus-2.13.0.linux-amd64.tar.gz
tar -xvf prometheus-2.13.0.linux-amd64.tar.gz
cd prometheus-2.13.0.linux-amd64/
cp prometheus promtool ${PROM_PATH}/bin/
cp prometheus.yml ${PROM_PATH}/config/
chown -R prometheus.prometheus /data/prometheus
# Setting Variables
cat >> /etc/profile <<EOF
PATH=/data/prometheus/bin:$PATH:$HOME/bin
EOF
创建Systemd Prometheus服务
cat >>/etc/systemd/system/prometheus.service <<EOF
[Unit]
Description=Prometheus
Documentation=https://prometheus.io/
After=network.target

[Service]
Type=simple
User=prometheus
ExecStart=/data/prometheus/bin/prometheus --config.file=/data/prometheus/conf/prometheus.yml --storage.tsdb.path=/data/prometheus/data --web.external-url=http://prom.k8stech.net --storage.tsdb.retention=90d
Restart=on-failure

[Install]
WantedBy=multi-user.target
EOF

systemctl enable prometheus.service
systemctl start prometheus.service
systemctl status prometheus.service
# 查看端口是否正常
netstat -anplt|grep 9090
tcp        0      0 127.0.0.1:47186         127.0.0.1:9090          ESTABLISHED 32069/prometheus
tcp        0      0 127.0.0.1:47188         127.0.0.1:9090          ESTABLISHED 32069/prometheus
tcp6       0      0 :::9090                 :::*                    LISTEN      32069/prometheus
tcp6       0      0 127.0.0.1:9090          127.0.0.1:47188         ESTABLISHED 32069/prometheus
tcp6       0      0 127.0.0.1:9090          127.0.0.1:47186         ESTABLISHED 32069/prometheus
Prometheus配置文件
# Alertmanager Rule 目录 与 文件
CONF_PATH='/data/prometheus/conf'
# 目录必须提前创建,否则Prometheus服务会无法启动
mkdir -p ${CONF_PATH}/rule/{op,ssl,prod}
mkdir -p ${CONF_PATH}/prod/domain_config

# prometheus conf file
cat > /data/prometheus/conf/prometheus.yml << EOF
# https://prometheus.io/docs/prometheus/latest/configuration/configuration/
# 全局配置
global:
  scrape_interval:     30s # 每15秒抓取一次数据,默认值为1分钟
  scrape_timeout: 30s
  evaluation_interval: 60s # 每15分钟检测一次可用性,默认值为1分钟
  #scrape_timeout: 60s # 全局设置超时时间,这个注掉了。

# Alertmanager配置,需要在targets添加ip和端口,也可以使用主机名和域名
alerting:
  alertmanagers:
    - static_configs:
        - targets: ['127.0.0.1:9093']

# 根据全局文件 'evaluation_interval' 的时间,根据 rule 文件进行检查,可配置多个。
rule_files:
  - "/data/prometheus/conf/rule/prod/*.yml"
  - "/data/prometheus/conf/rule/op/*.yml"
  - "/data/prometheus/conf/rule/ssl/*.yml"
  # - "second_rules.yml"
# 抓取配置配置
scrape_configs:
  - job_name: 'blackbox'
    metrics_path: /probe
    params:
      module: [http_2xx]  # Look for a HTTP 200 response.
    scrape_interval: 30s
    file_sd_configs:
      - files:
        - /data/prometheus/conf/prod/domain_config/*.yml
    relabel_configs:
      - source_labels: [__address__]
        target_label: __param_target
      - source_labels: [__param_target]
        target_label: instance
      - target_label: __address__
        replacement: 127.0.0.1:9115  # The blackbox exporter's real hostname:port.
  - job_name: 'prom'
    #honor_labels: true
    scrape_interval: 10s
    static_configs:
    - targets: ['172.26.42.229:9100']
      labels:
         op_region: 'cn-north-1'
         app:   'Prometheus'
         env:  'Server'
EOF
Nginx配置Basic_Auth访问
# 安装 Apache工具包
apt install apache2-utils
htpasswd -bc /etc/nginx/.prom_htpasswd admin admin
# nginx conf
cat > /etc/nginx/conf.d/prom.conf <<EOF
server {
    listen       80;
    server_name  prom.k8stech.net;
        auth_basic "Please input password";
        auth_basic_user_file /etc/nginx/.prom_htpasswd;
    location / {
            try_files $uri @prom;
    }
    location @prom {
            internal;
            proxy_pass http://localhost:9090;
    }
}
EOF
使用浏览器访问
user:admin
pass:admin
二进制安装Node_exporter
# prom server 安装
NODE_PATH='/data/prometheus/node_exporter/'
cd /usr/local/src/
mkdir -p ${NODE_PATH}
wget https://github.com/prometheus/node_exporter/releases/download/v0.18.0/node_exporter-0.18.0.linux-amd64.tar.gz && tar xvf node_exporter-0.18.0.linux-amd64.tar.gz
cp node_exporter-0.18.0.linux-amd64/node_exporter ${NODE_PATH}
chown -R prometheus.prometheus ${NODE_PATH}

# node节点安装
NODE_PATH='/data/prometheus/node_exporter/'
useradd prometheus && mkdir -p ${NODE_PATH}
cd /usr/local/src/
wget https://github.com/prometheus/node_exporter/releases/download/v0.18.0/node_exporter-0.18.0.linux-amd64.tar.gz && tar xvf node_exporter-0.18.0.linux-amd64.tar.gz
cp node_exporter-0.18.0.linux-amd64/node_exporter ${NODE_PATH}
chown -R prometheus.prometheus ${NODE_PATH}
创建Systemd Node_exporter服务
# 创建配置文件 Centos7 路径是/usr/lib/systemd/
cat > /lib/systemd/system/node_exporter.service <<EOF
[Unit]
Description=node_exporter
Documentation=https://prometheus.io/
After=network.target

[Service]
Type=simple
User=prometheus
ExecStart=/data/prometheus/node_exporter/node_exporter
Restart=on-failure

[Install]
WantedBy=multi-user.target
EOF

# 开机启动并运行服务
systemctl enable node_exporter.service
systemctl start node_exporter.service
systemctl status node_exporter.service

# 查看端口是否正常
netstat -anplt|grep 9100
tcp        0      0 172.26.42.229:58364     172.26.42.229:9100      ESTABLISHED 32220/prometheus
tcp6       0      0 :::9100                 :::*                    LISTEN      972/node_exporter
tcp6       0      0 172.26.42.229:9100      172.26.42.229:58364     ESTABLISHED 972/node_exporter
Node Metrics查看 访问9100端口即可。
Alertmanager集成Dingtalk/Wechat/Email报警
二进制安装Alertmanager
#创建服务相关文件目录
ALERT_PATH='/data/alertmanager'
mkdir -p ${ALERT_PATH}/{bin,conf,logs,templates}
cd /usr/local/src/
wget https://github.com/prometheus/alertmanager/releases/download/v0.18.0/alertmanager-0.18.0.linux-amd64.tar.gz && tar -xvf alertmanager-0.18.0.linux-amd64.tar.gz
cp alertmanager-0.18.0.linux-amd64/alertmanager /data/prometheus/alertmanager/bin/
cp alertmanager-0.18.0.linux-amd64/amtool /data/prometheus/alertmanager/bin/
chown -R prometheus.prometheus /data/alertmanager

# Setting Variables
cat >> /etc/profile <<EOF
PATH=/data/alertmanager/bin:$PATH:$HOME/bin
EOF
创建Alertmanager配置文件
cat > /data/alertmanager/conf/alertmanager.yml <<EOF
global:
  resolve_timeout: 5m
  # smtp配置
  smtp_from: "prom-alert@example.com"
  smtp_smarthost: 'email-smtp.us-west-2.amazonaws.com:465'
  smtp_auth_username: "user"
  smtp_auth_password: "pass"
  smtp_require_tls: true
templates:
  - '/data/alertmanager/templates/*.tmpl'
route:
  receiver: test1
  group_wait: 30s
  group_interval: 5m
  repeat_interval: 4h
  group_by: [alertname]
  routes:
# ads webhook
  - receiver: test1
    group_wait: 10s
    match:
      team: ads
# ops webhook
  - receiver: test2
    group_wait: 10s
    match:
      team: operations
receivers:
- name: test1
  email_configs:
  - to: '9935226@qq.com'
    headers: { Subject: "[ads] 报警邮件"} # 接收邮件的标题
  webhook_configs:
  - url: http://localhost:8060/dingtalk/ads/send

- name: test2
  email_configs:
  - to: '9935226@qq.com,deniss.wang@gmail.com'
    send_resolved: true
    headers: { Subject: "[ops] 报警邮件"} # 接收邮件的标题
  webhook_configs:
  - url: http://localhost:8060/dingtalk/ops/send
    # wx config
  wechat_configs:
  - corp_id: 'wwxxxxxxxxxxxxxx'
    api_url: 'https://qyapi.weixin.qq.com/cgi-bin/'
    send_resolved: true
    to_party: '2'
    agent_id: '1000002'
    api_secret: '1FvHxuGbbG35FYsuW0YyI4czWY/.2'
EOF
创建Systemd Node_exporter服务
# alertmanager.service
cat >/lib/systemd/system/alertmanager.service<<\EOF
[Unit]
Description=Prometheus: the alerting system
Documentation=http://prometheus.io/docs/
After=prometheus.service

[Service]
ExecStart=/data/alertmanager/bin/alertmanager --config.file=/data/alertmanager/conf/alertmanager.yml
Restart=always
StartLimitInterval=0
RestartSec=10

[Install]
WantedBy=multi-user.target
EOF

# 启动服务
systemctl enable alertmanager.service
systemctl start alertmanager.service
systemctl status alertmanager.service

# 查看端口是否正常
netstat -anplt|grep 9093
tcp6       0      0 :::9093                 :::*                    LISTEN      1547/alertmanager
将Dingtalk接入 Prometheus AlertManager WebHook
在钉钉中申请钉钉机器人:
二进制与Docker方式安装Dingtalk-Webhook插件插件
此插件安装方式分源码编译安装,二进制安装与Docker部署,此处只对二进制与Docker方式讲解,源码编译安装可去GitHub查看详情。
cd /usr/local/src/
wget https://github.com/timonwong/prometheus-webhook-dingtalk/releases/download/v0.3.0/prometheus-webhook-dingtalk-0.3.0.linux-amd64.tar.gz
tar -zxvf prometheus-webhook-dingtalk-0.3.0.linux-amd64.tar.gz
mv prometheus-webhook-dingtalk-0.3.0.linux-amd64 /data/alertmanager/webhook-dingtalk

# 创建Systemd webhook-dingtalk 服务
cat > /etc/systemd/system/webhook-dingtalk.service << EOF
[Unit]
Description=webhook-dingding
Documentation=https://prometheus.io/
After=network.target

[Service]
Type=simple
User=prometheus
ExecStart=/data/alertmanager/webhook-dingtalk/prometheus-webhook-dingtalk \
--ding.profile="ads=https://oapi.dingtalk.com/robot/send?access_token=284de68124e97420a2ee8ae1b8f12fabe3213213213" \
--ding.profile="ops=https://oapi.dingtalk.com/robot/send?access_token=8bce3bd11f7040d57d44caa5b6ef9417eab24e1123123123213"
Restart=on-failure

[Install]
WantedBy=multi-user.target
EOF

# 启动服务
systemctl enable webhook-dingtalk
systemctl start webhook-dingtalk
systemctl status webhook-dingtalk

# 查看端口是否正常
netstat -anplt|grep 8060
tcp6       0      0 :::8060                 :::*                    LISTEN      1635/prometheus-web
docker方式部署插件
# Pull Image
docker pull timonwong/prometheus-webhook-dingtalk:v0.3.0

# 启动
docker run -d --restart always -p 8060:8060 timonwong/prometheus-webhook-dingtalk:v0.3.0 --ding.profile="ads=https://oapi.dingtalk.com/robot/send?access_token=284de68124e97420a2ee8ae1b8f12fabe3213213213" \
--ding.profile="ops=https://oapi.dingtalk.com/robot/send?access_token=8bce3bd11f7040d57d44caa5b6ef9417eab24e1123123123213"
Grafana安装及配置
# Ubuntu
wget https://dl.grafana.com/oss/release/grafana_6.4.0_amd64.deb
sudo dpkg -i grafana_6.4.0_amd64.deb

# Centos7
yum localinstall -y https://dl.grafana.com/oss/release/grafana-6.4.4-1.x86_64.rpm

# 安装拼图、Consul数据源插件
grafana-cli plugins install grafana-piechart-panel
grafana-cli plugins install sbueringer-consul-datasource
systemctl restart grafana-server.service

# 启动服务
systemctl enable grafana-server.service
systemctl start grafana-server.service
systemctl status grafana-server.service

# nginx 配置
cat > /etc/nginx/conf.d/grafana.k8stech.net.conf << EOF
server {
    listen       80;
    server_name  grafana.k8stech.net;

    location / {
            try_files $uri @grafana;
    }

    location @grafana {
            internal;
            proxy_pass http://localhost:3000;
    }
}
EOF
使用浏览器访问Grafana WEB界面
http://grafana.k8stech.net user/pass:admin/admin
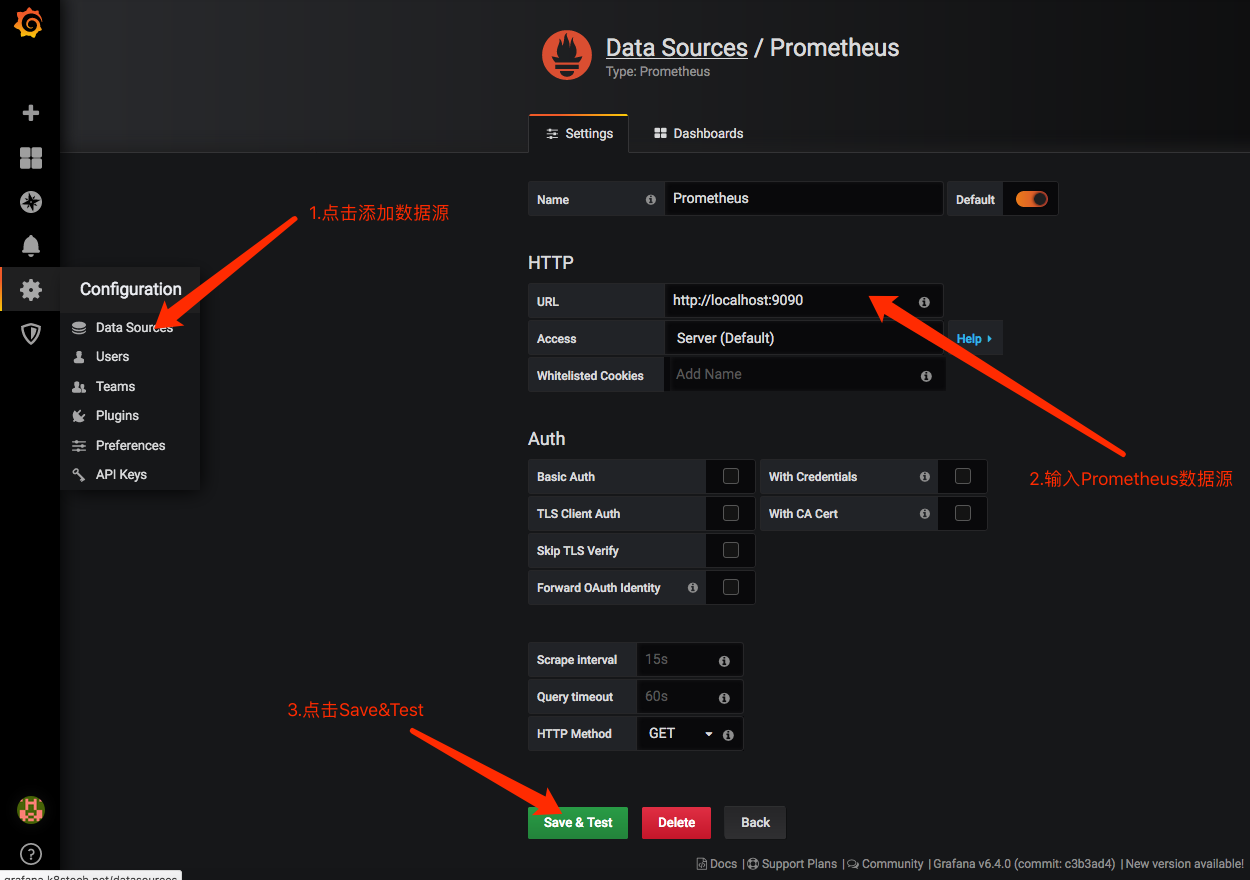
Grafana添加数据源
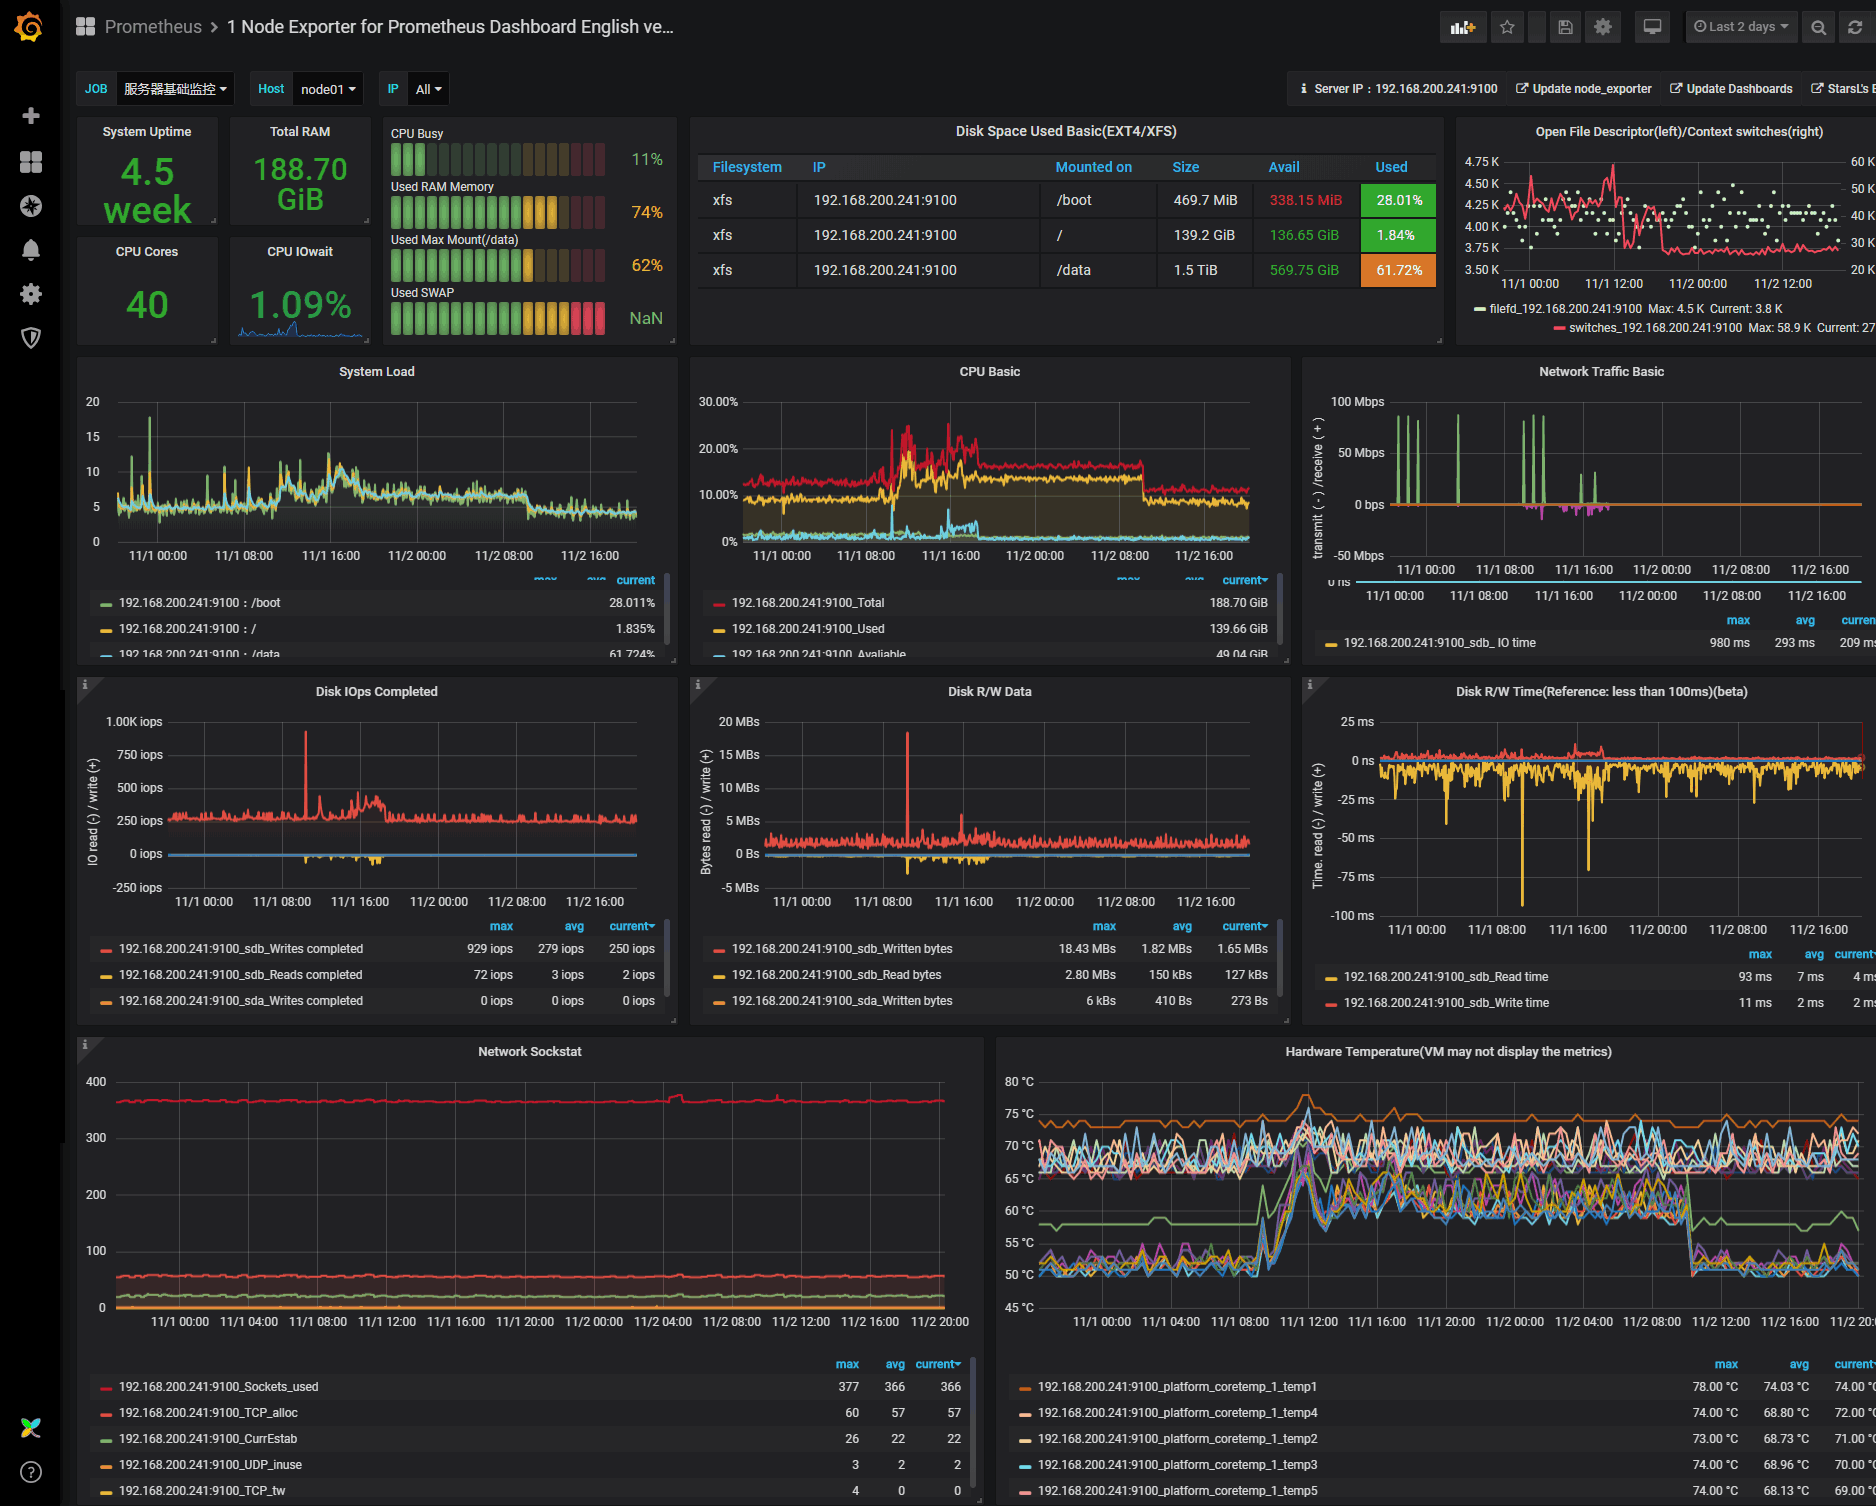
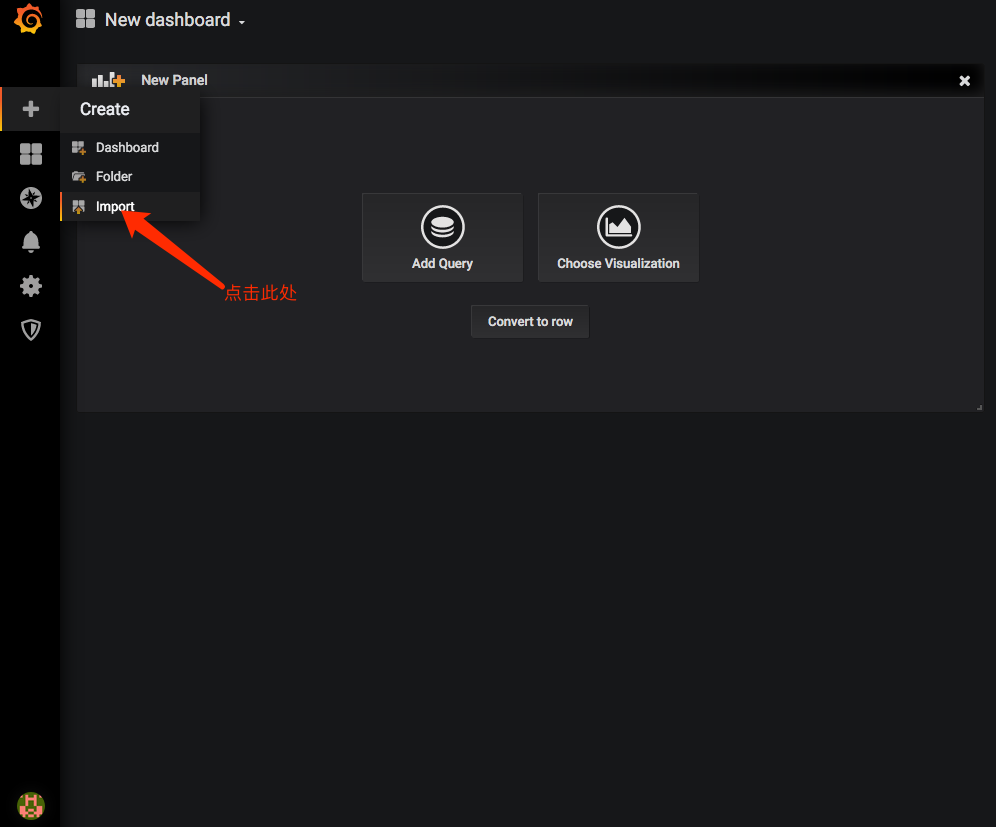
grafana导入Dashboard
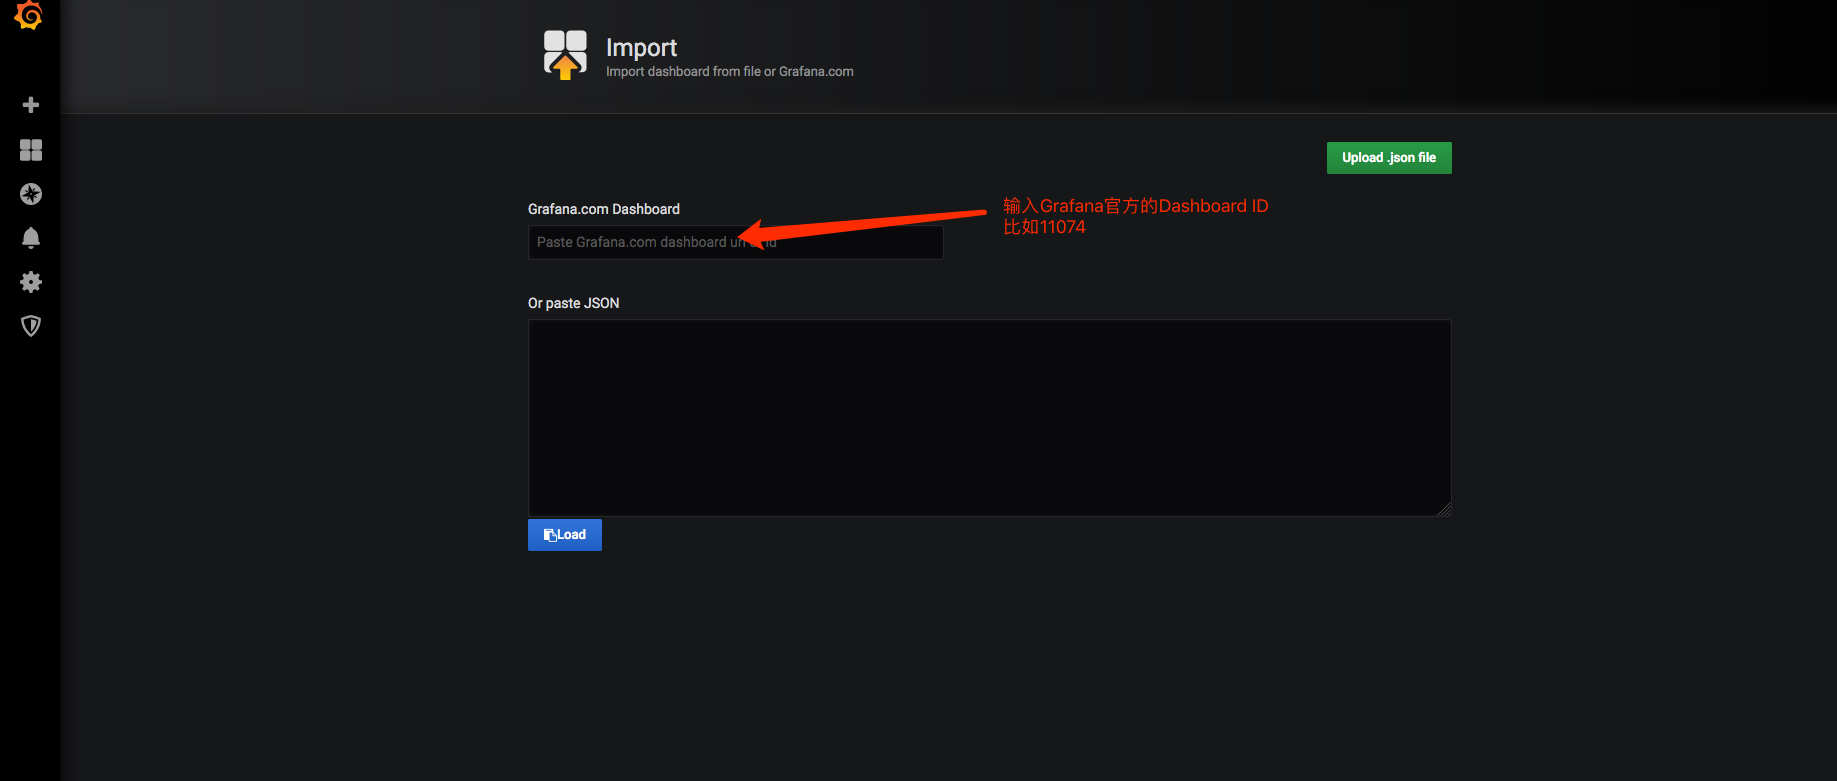
host-dashboard-1:https://grafana.com/grafana/dashboards/11074
host-dashboard-2:https://grafana.com/dashboards/8919
database-dashboard:https://grafana.com/dashboards/7362
至此,Prometheus安装与简单的配置、集成Grafana展示已经完成;对于Alertmanager,在此篇中仅仅是对邮件、Dingtalk、企业微信做了集成,下一篇幅,我们详细的讲讲Alertmanager的配置与Rule规则等。
微信公众号
扫描下面的二维码关注我的微信公众号,在微信公众帐号中回复'群'即可加入到我的"kubernetes技术栈"讨论群里面共同学习。

「真诚赞赏,手有余香」
请我喝杯咖啡?
使用微信扫描二维码完成支付