52. 在 Kubernets 中手动安装 Prometheus
从今天开始我们就和大家一起来学习 Kubernetes 中监控系统的搭建,我们知道监控是保证系统运行必不可少的功能,特别是对于 Kubernetes 这种比较庞大的系统来说,监控报警更是不可或缺,我们需要时刻了解系统的各种运行指标,也需要时刻了解我们的 Pod 的各种指标,更需要在出现问题的时候有报警信息通知到我们。
在早期的版本中 Kubernetes 提供了 heapster、influxDB、grafana 的组合来监控系统,所以我们可以在 Dashboard 中看到 heapster 提供的一些图表信息,在后续的版本中会陆续移除掉 heapster,现在更加流行的监控工具是 prometheus,prometheus 是 Google 内部监控报警系统的开源版本,是 Google SRE 思想在其内部不断完善的产物,它的存在是为了更快和高效的发现问题,快速的接入速度,简单灵活的配置都很好的解决了这一切,而且是已经毕业的 CNCF 项目。
这里推荐一本书了解 Goolge 运维的秘密:《SRE: Google运维解密》
简介
Prometheus 最初是 SoundCloud 构建的开源系统监控和报警工具,是一个独立的开源项目,于2016年加入了 CNCF 基金会,作为继 Kubernetes 之后的第二个托管项目。
特征
Prometheus 相比于其他传统监控工具主要有以下几个特点:
- 具有由 metric 名称和键/值对标识的时间序列数据的多维数据模型
- 有一个灵活的查询语言
- 不依赖分布式存储,只和本地磁盘有关
- 通过 HTTP 的服务拉取时间序列数据
- 也支持推送的方式来添加时间序列数据
- 还支持通过服务发现或静态配置发现目标
- 多种图形和仪表板支持
组件
Prometheus 由多个组件组成,但是其中许多组件是可选的:
- Prometheus Server:用于抓取指标、存储时间序列数据
- exporter:暴露指标让任务来抓
- pushgateway:push 的方式将指标数据推送到该网关
- alertmanager:处理报警的报警组件
- adhoc:用于数据查询
大多数 Prometheus 组件都是用 Go 编写的,因此很容易构建和部署为静态的二进制文件。
架构
下图是 Prometheus 官方提供的架构及其一些相关的生态系统组件:
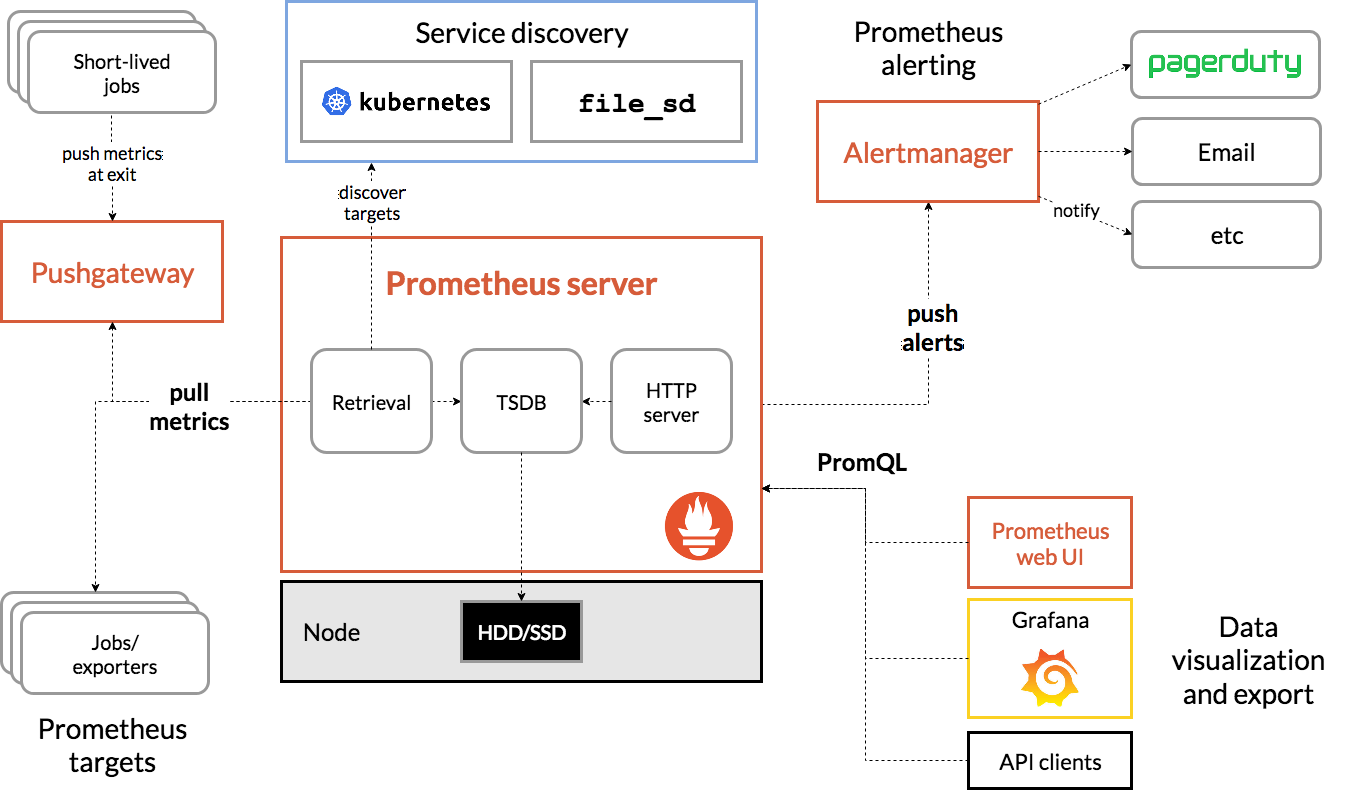
整体流程比较简单,Prometheus 直接接收或者通过中间的 Pushgateway 网关被动获取指标数据,在本地存储所有的获取的指标数据,并对这些数据进行一些规则整理,用来生成一些聚合数据或者报警信息,Grafana 或者其他工具用来可视化这些数据。
安装
由于 Prometheus 是 Golang 编写的程序,所以要安装的话也非常简单,只需要将二进制文件下载下来直接执行即可,前往地址:https://prometheus.io/download 下载我们对应的版本即可。
Prometheus 是通过一个 YAML 配置文件来进行启动的,如果我们使用二进制的方式来启动的话,可以使用下面的命令:
$ ./prometheus --config.file=prometheus.yml
其中 prometheus.yml 文件的基本配置如下:
global:
  scrape_interval:     15s
  evaluation_interval: 15s

rule_files:
  # - "first.rules"
  # - "second.rules"

scrape_configs:
  - job_name: prometheus
    static_configs:
      - targets: ['localhost:9090']
上面这个配置文件中包含了3个模块:global、rule_files 和 scrape_configs。
其中 global 模块控制 Prometheus Server 的全局配置:
- scrape_interval:表示 prometheus 抓取指标数据的频率,默认是15s,我们可以覆盖这个值
- evaluation_interval:用来控制评估规则的频率,prometheus 使用规则产生新的时间序列数据或者产生警报
rule_files 模块制定了规则所在的位置,prometheus 可以根据这个配置加载规则,用于生成新的时间序列数据或者报警信息,当前我们没有配置任何规则。
scrape_configs 用于控制 prometheus 监控哪些资源。由于 prometheus 通过 HTTP 的方式来暴露的它本身的监控数据,prometheus 也能够监控本身的健康情况。在默认的配置里有一个单独的 job,叫做prometheus,它采集 prometheus 服务本身的时间序列数据。这个 job 包含了一个单独的、静态配置的目标:监听 localhost 上的9090端口。prometheus 默认会通过目标的/metrics路径采集 metrics。所以,默认的 job 通过 URL:http://localhost:9090/metrics采集 metrics。收集到的时间序列包含 prometheus 服务本身的状态和性能。如果我们还有其他的资源需要监控的话,直接配置在该模块下面就可以了。
由于我们这里是要跑在 Kubernetes 系统中,所以我们直接用 Docker 镜像的方式运行即可。
为了方便管理,我们将所有的资源对象都安装在
kube-ops的 namespace 下面,没有的话需要提前安装。
为了能够方便的管理配置文件,我们这里将 prometheus.yml 文件用 ConfigMap 的形式进行管理:(prometheus-cm.yaml)
apiVersion: v1
kind: ConfigMap
metadata:
  name: prometheus-config
  namespace: kube-ops
data:
  prometheus.yml: |
    global:
      scrape_interval: 15s
      scrape_timeout: 15s
    scrape_configs:
    - job_name: 'prometheus'
      static_configs:
      - targets: ['localhost:9090']
我们这里暂时只配置了对 prometheus 的监控,然后创建该资源对象:
$ kubectl create -f prometheus-cm.yaml
configmap "prometheus-config" created
配置文件创建完成了,以后如果我们有新的资源需要被监控,我们只需要将上面的 ConfigMap 对象更新即可。现在我们来创建 prometheus 的 Pod 资源:(prometheus-deploy.yaml)
apiVersion: extensions/v1beta1
kind: Deployment
metadata:
  name: prometheus
  namespace: kube-ops
  labels:
    app: prometheus
spec:
  template:
    metadata:
      labels:
        app: prometheus
    spec:
      serviceAccountName: prometheus
      containers:
      - image: prom/prometheus:v2.4.3
        name: prometheus
        command:
        - "/bin/prometheus"
        args:
        - "--config.file=/etc/prometheus/prometheus.yml"
        - "--storage.tsdb.path=/prometheus"
        - "--storage.tsdb.retention=24h"
        - "--web.enable-admin-api"  # 控制对admin HTTP API的访问,其中包括删除时间序列等功能
        - "--web.enable-lifecycle"  # 支持热更新,直接执行localhost:9090/-/reload立即生效
        ports:
        - containerPort: 9090
          protocol: TCP
          name: http
        volumeMounts:
        - mountPath: "/prometheus"
          subPath: prometheus
          name: data
        - mountPath: "/etc/prometheus"
          name: config-volume
        resources:
          requests:
            cpu: 100m
            memory: 512Mi
          limits:
            cpu: 100m
            memory: 512Mi
      securityContext:
        runAsUser: 0
      volumes:
      - name: data
        persistentVolumeClaim:
          claimName: prometheus
      - configMap:
          name: prometheus-config
        name: config-volume
我们在启动程序的时候,除了指定了 prometheus.yml 文件之外,还通过参数storage.tsdb.path指定了 TSDB 数据的存储路径、通过storage.tsdb.retention设置了保留多长时间的数据,还有下面的web.enable-admin-api参数可以用来开启对 admin api 的访问权限,参数web.enable-lifecycle非常重要,用来开启支持热更新的,有了这个参数之后,prometheus.yml 配置文件只要更新了,通过执行localhost:9090/-/reload就会立即生效,所以一定要加上这个参数。
我们这里将 prometheus.yml 文件对应的 ConfigMap 对象通过 volume 的形式挂载进了 Pod,这样 ConfigMap 更新后,对应的 Pod 里面的文件也会热更新的,然后我们再执行上面的 reload 请求,Prometheus 配置就生效了,除此之外,为了将时间序列数据进行持久化,我们将数据目录和一个 pvc 对象进行了绑定,所以我们需要提前创建好这个 pvc 对象:(prometheus-volume.yaml)
apiVersion: v1
kind: PersistentVolume
metadata:
  name: prometheus
spec:
  capacity:
    storage: 10Gi
  accessModes:
  - ReadWriteOnce
  persistentVolumeReclaimPolicy: Recycle
  nfs:
    server: 10.151.30.57
    path: /data/k8s

---
apiVersion: v1
kind: PersistentVolumeClaim
metadata:
  name: prometheus
  namespace: kube-ops
spec:
  accessModes:
  - ReadWriteOnce
  resources:
    requests:
      storage: 10Gi
我们这里简单的通过 NFS 作为存储后端创建一个 pv、pvc 对象:
$ kubectl create -f prometheus-volume.yaml
除了上面的注意事项外,我们这里还需要配置 rbac 认证,因为我们需要在 prometheus 中去访问 Kubernetes 的相关信息,所以我们这里管理了一个名为 prometheus 的 serviceAccount 对象:(prometheus-rbac.yaml)
apiVersion: v1
kind: ServiceAccount
metadata:
  name: prometheus
  namespace: kube-ops
---
apiVersion: rbac.authorization.k8s.io/v1
kind: ClusterRole
metadata:
  name: prometheus
rules:
- apiGroups:
  - ""
  resources:
  - nodes
  - services
  - endpoints
  - pods
  - nodes/proxy
  verbs:
  - get
  - list
  - watch
- apiGroups:
  - ""
  resources:
  - configmaps
  - nodes/metrics
  verbs:
  - get
- nonResourceURLs:
  - /metrics
  verbs:
  - get
---
apiVersion: rbac.authorization.k8s.io/v1beta1
kind: ClusterRoleBinding
metadata:
  name: prometheus
roleRef:
  apiGroup: rbac.authorization.k8s.io
  kind: ClusterRole
  name: prometheus
subjects:
- kind: ServiceAccount
  name: prometheus
  namespace: kube-ops
由于我们要获取的资源信息,在每一个 namespace 下面都有可能存在,所以我们这里使用的是 ClusterRole 的资源对象,值得一提的是我们这里的权限规则声明中有一个nonResourceURLs的属性,是用来对非资源型 metrics 进行操作的权限声明,这个在以前我们很少遇到过,然后直接创建上面的资源对象即可:
$ kubectl create -f prometheus-rbac.yaml
serviceaccount "prometheus" created
clusterrole.rbac.authorization.k8s.io "prometheus" created
clusterrolebinding.rbac.authorization.k8s.io "prometheus" created
还有一个要注意的地方是我们这里必须要添加一个securityContext的属性,将其中的runAsUser设置为0,这是因为现在的 prometheus 运行过程中使用的用户是 nobody,否则会出现下面的permission denied之类的权限错误:
level=error ts=2018-10-22T14:34:58.632016274Z caller=main.go:617 err="opening storage failed: lock DB directory: open /data/lock: permission denied"
现在我们就可以添加 promethues 的资源对象了:
$ kubectl create -f prometheus-deploy.yaml
deployment.extensions "prometheus" created
$ kubectl get pods -n kube-ops
NAME                          READY     STATUS    RESTARTS   AGE
prometheus-6dd775cbff-zb69l   1/1       Running   0          20m
$ kubectl logs -f prometheus-6dd775cbff-zb69l -n kube-ops
......
level=info ts=2018-10-22T14:44:40.535385503Z caller=main.go:523 msg="Server is ready to receive web requests."
Pod 创建成功后,为了能够在外部访问到 prometheus 的 webui 服务,我们还需要创建一个 Service 对象:(prometheus-svc.yaml)
apiVersion: v1
kind: Service
metadata:
  name: prometheus
  namespace: kube-ops
  labels:
    app: prometheus
spec:
  selector:
    app: prometheus
  type: NodePort
  ports:
    - name: web
      port: 9090
      targetPort: http
为了方便测试,我们这里创建一个NodePort类型的服务,当然我们可以创建一个Ingress对象,通过域名来进行访问:
$ kubectl create -f prometheus-svc.yaml
service "prometheus" created
$ kubectl get svc -n kube-ops
NAME         TYPE       CLUSTER-IP       EXTERNAL-IP   PORT(S)                          AGE
prometheus   NodePort   10.111.118.104   <none>        9090:30987/TCP                   24s
然后我们就可以通过http://任意节点IP:30987访问 prometheus 的 webui 服务了。
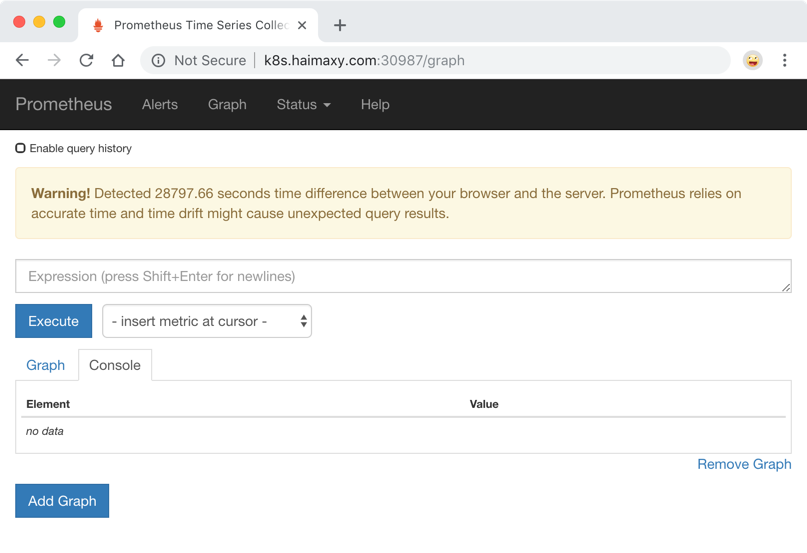
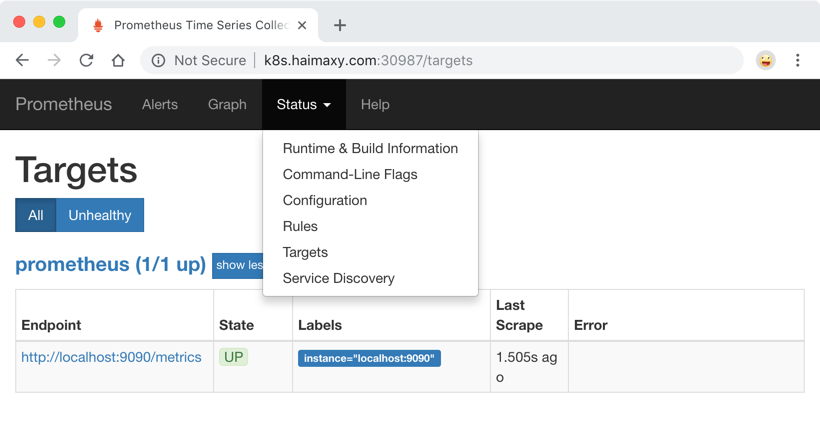
为了数据的一致性,prometheus 所有的数据都是使用的 UTC 时间,所以我们默认打开的 dashboard 中有这样一个警告,我们需要在查询的时候指定我们当前的时间才可以。然后我们可以查看当前监控系统中的一些监控目标:
由于我们现在还没有配置任何的报警信息,所以 Alerts 菜单下面现在没有任何数据,隔一会儿,我们可以去 Graph 菜单下面查看我们抓取的 prometheus 本身的一些监控数据了,其中- insert metrics at cursor -下面就是我们搜集到的一些监控数据指标:
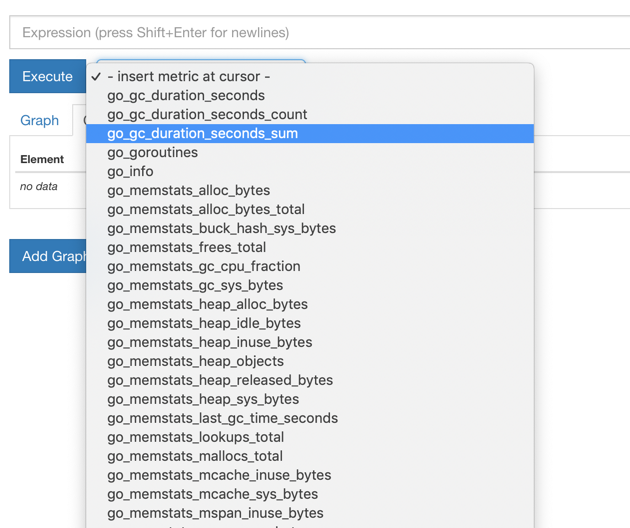
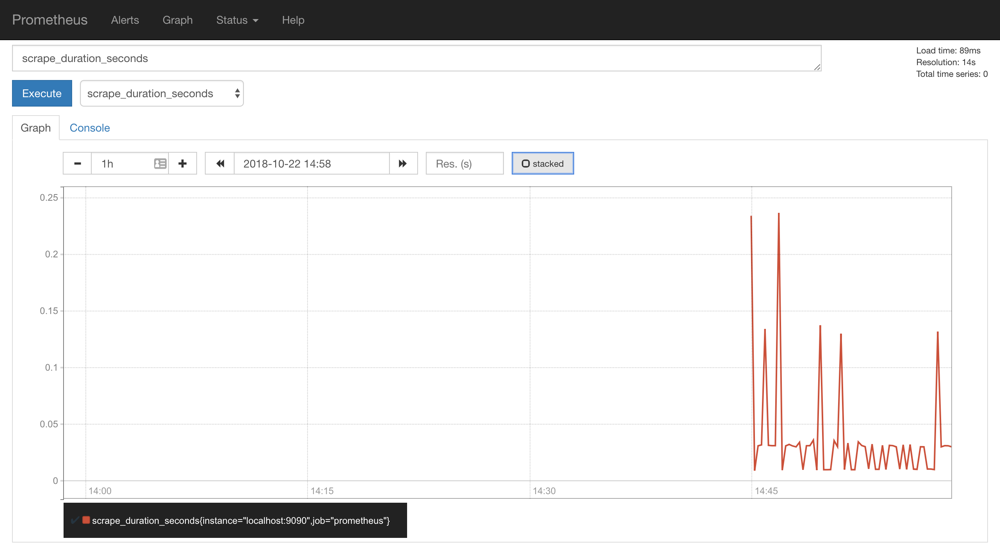
比如我们这里就选择scrape_duration_seconds这个指标,然后点击Execute,如果这个时候没有查询到任何数据,我们可以切换到Graph这个 tab 下面重新选择下时间,选择到当前的时间点,重新执行,就可以看到类似于下面的图表数据了:
除了简单的直接使用采集到的一些监控指标数据之外,这个时候也可以使用强大的 PromQL 工具,PromQL其实就是 prometheus 便于数据聚合展示开发的一套 ad hoc 查询语言的,你想要查什么找对应函数取你的数据好了。
下节课我们再来和大家学习怎样使用 Prometheus 来监控 Kubernetes 系统的组件以及常用的资源对象的监控。
扫描下面的二维码(或微信搜索Kubernetes技术栈)关注我们的微信公众帐号,在微信公众帐号中回复 群 即可加入到我们的 kubernetes 讨论群里面共同学习。